Description
Jake Ryland Williams
Assistant Professor
Department of Information Science
College of Computing and Informatics
Drexel University
Some themes
EDA should always come first in a data science project,
allowing first for assessment of data integrity,
but also for modeling and hypothesis generation.
Data should be characterized from every angle.
EDA on its own does not constitute a complete study.
EDA helps to set the direction of a project.
Exploratory data analysis
Data description falls under the umbrella of EDA,
which after pre-processing, is a preliminary analysis
that is an opportunity to check and summarize data.
Attention is given to checking the integrity of data
and making modeling decisions for the next stage of a project.
If data are in any way unfit for further analysis
EDA provides the direction to go back and continue munging
and if interesting patterns are found through summarization,
they can direct hypotheses and modeling decisions.
Getting the big picture
An import EDA outcome is overview understanding,
which can be accomplished through a number of mechanisms.
If data are human readable (text), or structured (tables),
viewing a sample of record can indicate sparsity or domain,
but when data is Big this is not always effective,
which is where summarization and visualization come in.
Summarization often covers counting, centrality, and variation,
and is closely tied to data visualization
which is focused on in Ch. 10.
Performing EDA
We've read a little about the already from John Tukey.
Tukey also wrote a whole book: Exploratory Data Analysis,
inspiring the creation of statistical programming languages.
Without these, EDA in data science would not be possible
with so much data and so many ways for representation.
Examples include R, Python, Matlab, and Mathematica,
and have large communities of scientific developers
who make reusable tools for data processing and visualization.
Some languages are open source, some require licenses,
and all have their strengths and weaknesses.
Commonality and centrality
A a good first step is to see if one value represents many,
and ask "which values appear most frequently?"
A most common element in some data is called a "mode."
When data is numeric, centrality, or the "middle," relevant.
The middle is not always well-defined,
and it can be measured through a variety of mechanisms.
One way of measuring the middle of data is with the median,
which is the value that has 50% of the data smaller,
and is just one of many "percentiles,"
e.g., a 35th percentile has 35% of the data smaller, etcetera.
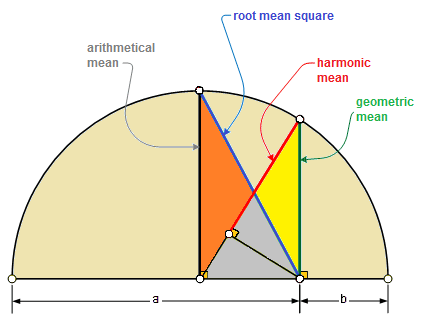
Means
- Means (averages) also measure centrality:
-
The arithmetic mean (expected value) is most common:
-
the geometric mean is for products:
-
and the harmonic mean is for rates:
Spread
It's also important to describe how numeric data are dispersed,
i.e., are data bunched up or spread apart?
Measures of spread describe how varied data are.
Observing the different percentiles can indicate spread,
which is one way box plots (visualization) accomplish this.
Spread is also commonly measured by variance,
and it's square root, the standard deviation,
which is often used for "whiskers" of box plots.
Variance
Variance is computed as the arithmetic average of
squared-differences from the arithmetic mean:
Squaring keeps things positive, but expresses the wrong units.
To undo squaring, we can take the square root
which is called the standard deviation (SD).
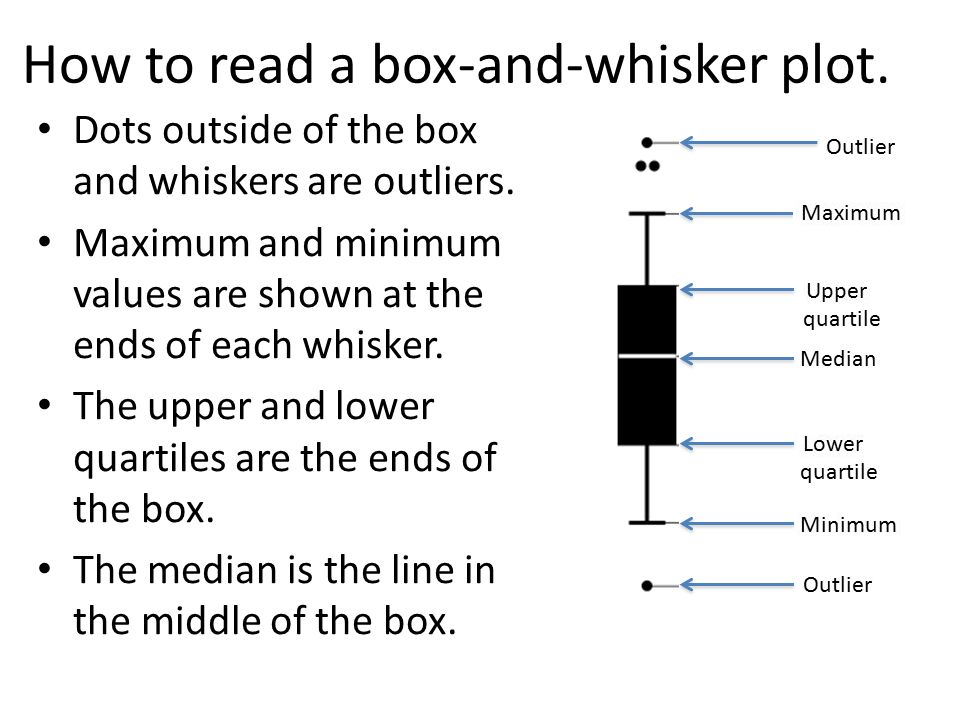
Box and whiskers
Box and whiskers plot are a simple data visualization
that describe both centrality and spread for numeric data.
The "box" shows 25th and 75th percentiles (bottom and top),
in addition to the 50th percentile (median) through the middle.
"Whiskers" extend from the box to extreme points,
often out to the farthest points within 1.5 SDs.
Points beyond whiskers are considered extreme, or, "outliers."
Extreme variation
Human heights, weights, etc., are "normal" (bell-shaped).
Normal variation is not very "extreme."
When data is normal, means and median are very similar.
The median and harmonic mean are robust to extremeness.
- Some example sources of extreme data:
-
social networks
-
city sizes
-
stock prices
-
seismic events
-
weather events
-
celestial objects
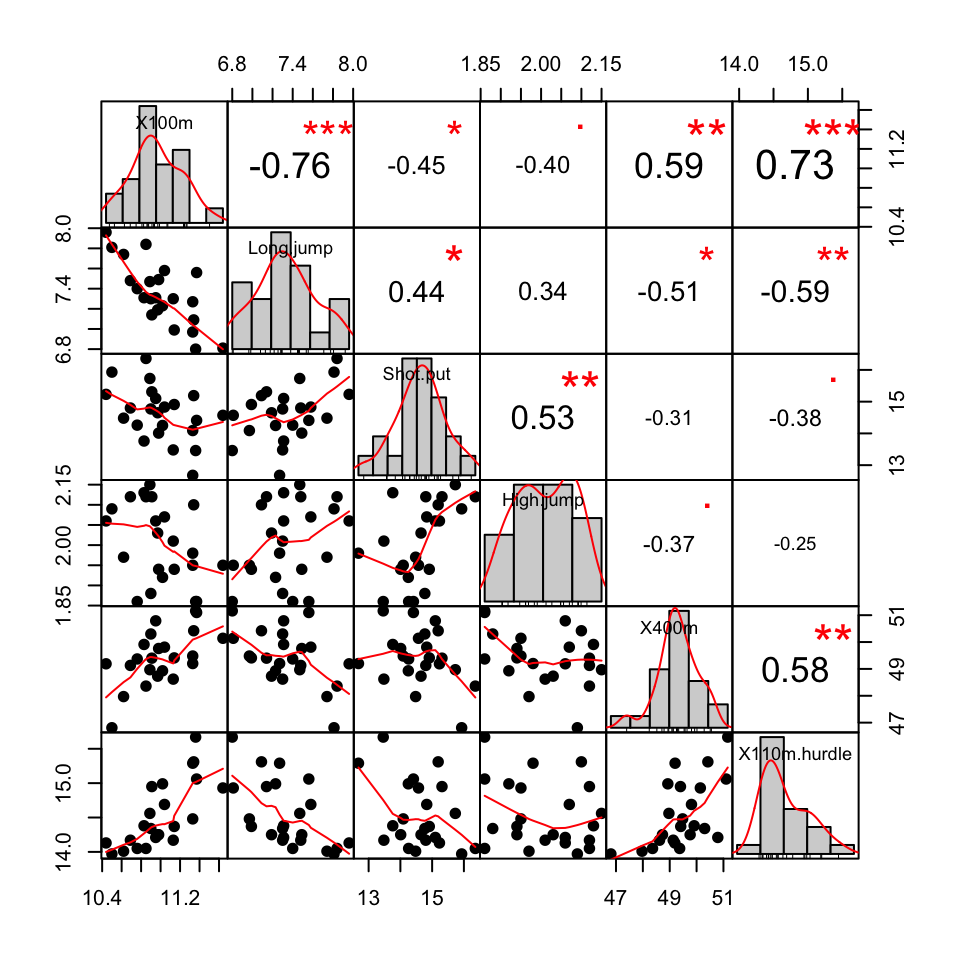
Co-variation
Quantiles and deviations express 1-dimensional spread.
It can important to describe how data vary together,
e.g., does height correspond to weight?
Scatter plots only exhibit variation in 2 or 3 dimensions,
so pair-wise comparisons are a common visual approach.
This is where methods for "correlation" come into play,
which quantify the variation one variable explains in another.
Common methods include Pearson's and Spearman's,
which hinge on different assumptions,
though higher values generally mean "more related."
Hypotheses generation
Where should a project go after EDA?
A central goal of EDA is data characterization.
A good outcome of EDA could be testable questions,
but a necessary outcome might be removal of some data
Or having to go back to a pre-processing stage.
- Some testable questions might be:
-
Do one or more variables predict others?
-
Does some behavior generate outliers?
-
Do sales of an item trend with some particular marketing?
-
Can a future participation be predicted?
-
Is growth exponential or unsustainable? Will it crash?
Recap
EDA should always come first in a data science project,
allowing first for assessment of data integrity,
but also for modeling and hypothesis generation.
Data should be characterized from every angle.
EDA on its own does not constitute a complete study.
EDA helps to set the direction of a project.
- Next time: Depiction
-
What are some common visualization types?
-
How can visualizations be interpreted?
-
What are best practices with visualization?